Ielts Writing Task 1 Bar Chart | 8 Band Sample
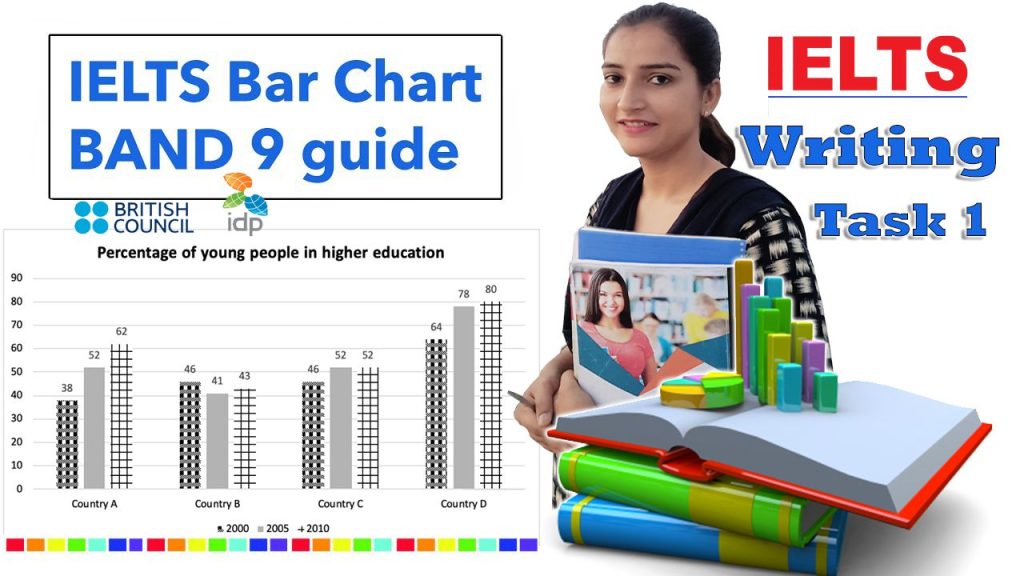
The chart below shows the percentage of young people in higher education in four different countries in 2000, 2005, and 2010. The bar graph illustrates the proportion of youth in higher education in four different countries between 2000 and 2010. Overall, it can be seen that country D had the highest proportion of youth enrolled […]
IELTS Writing Task 1 Bar graph leisure activities
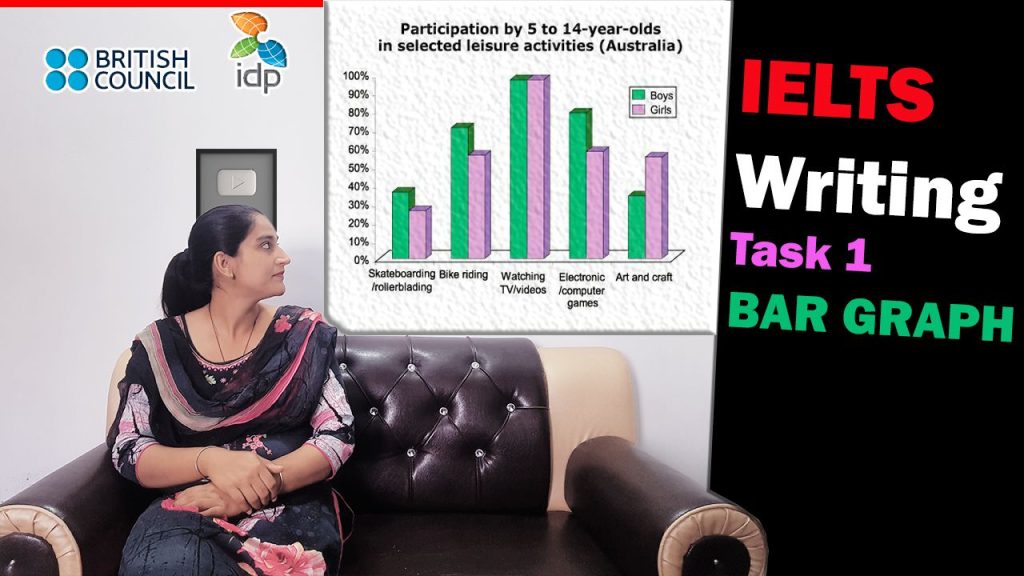
The bar chart below show the participation of children in selected leisure activities in Australia The given bar chart shows the proportion of boys and girls in the age group of 5 to 14 years engaged in various pastime activities. Overall, it can be seen that more boys than girls participate in various leisure activities. […]